Every sale, split the way you actually think about it.
Net sales, orders, average ticket, tips, refunds, discounts and fees — live from your POS, split by daypart, channel, payment method and location, each in its own local time. Then the heatmap that shows when the money actually lands.

Example data from the demo café in the live product.
Sales reporting, up close.
Dayparts
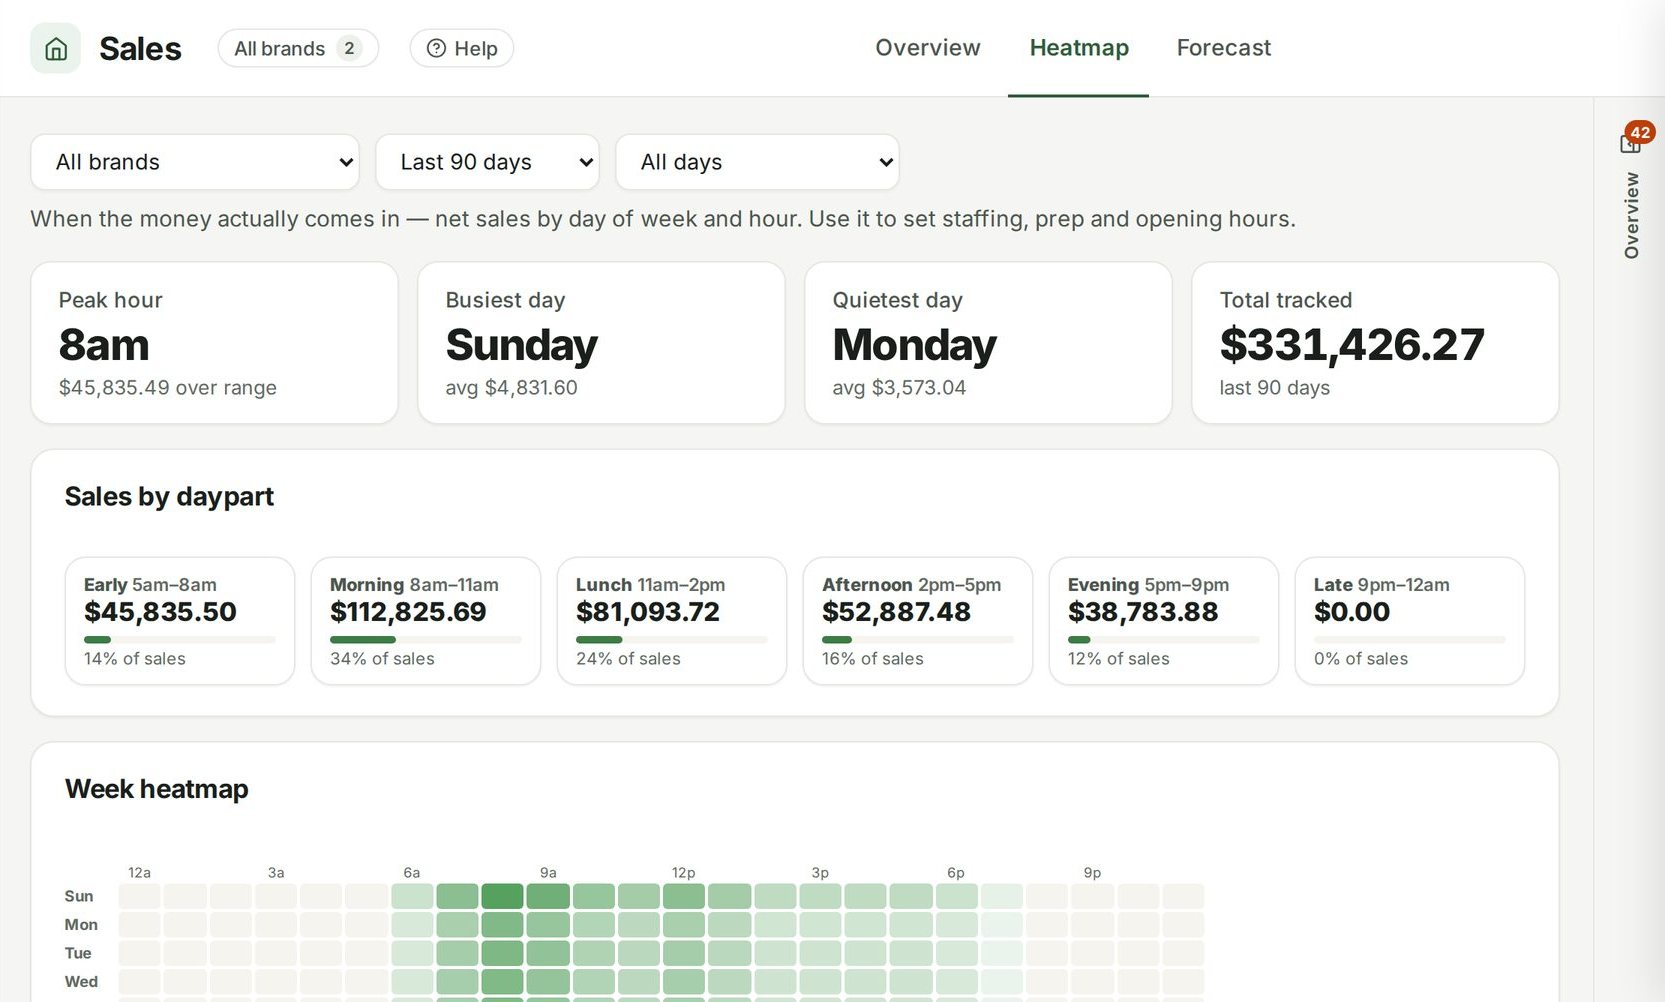
Early, morning, lunch, afternoon, evening and late, each with its share of sales — the picture you set staffing and prep around.
The week heatmap
Day of week against hour of day, shaded by sales, with the busiest and quietest days called out.
Items, categories and payouts
Top sellers and slow movers, category mix, payment methods, processing fees and payouts.
Any range, any comparison
Today, 7, 30 or 90 days, a year or a custom range, compared with the period before, filtered by channel and weekday.
Connected to
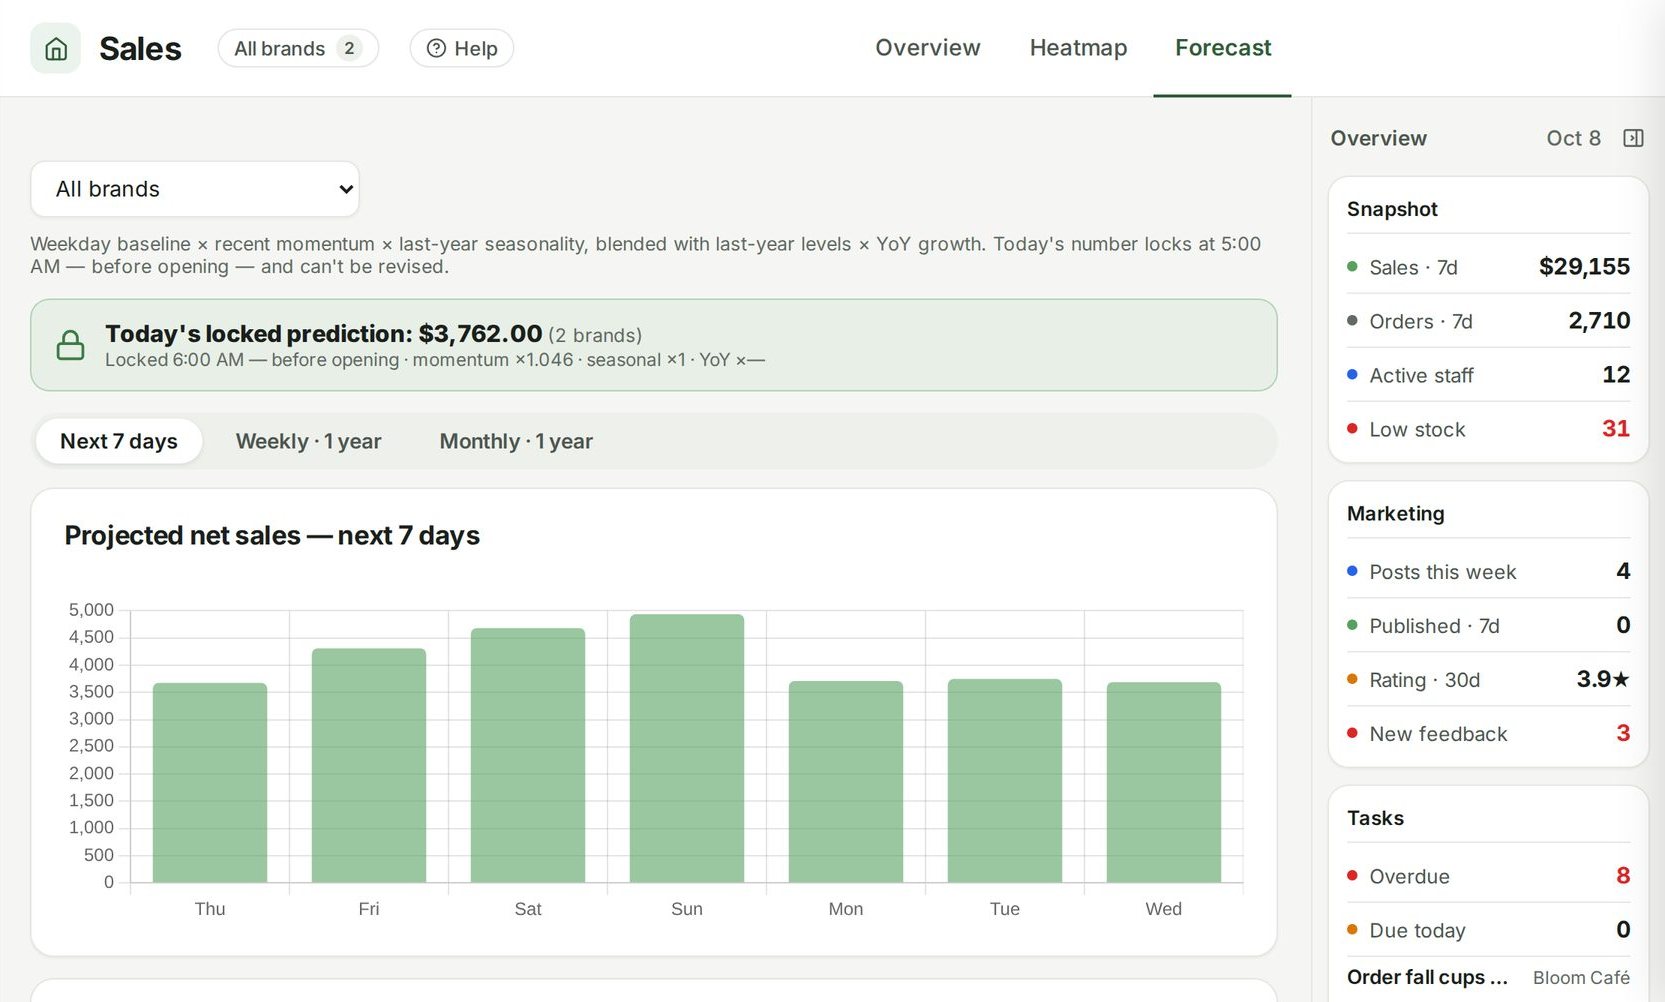
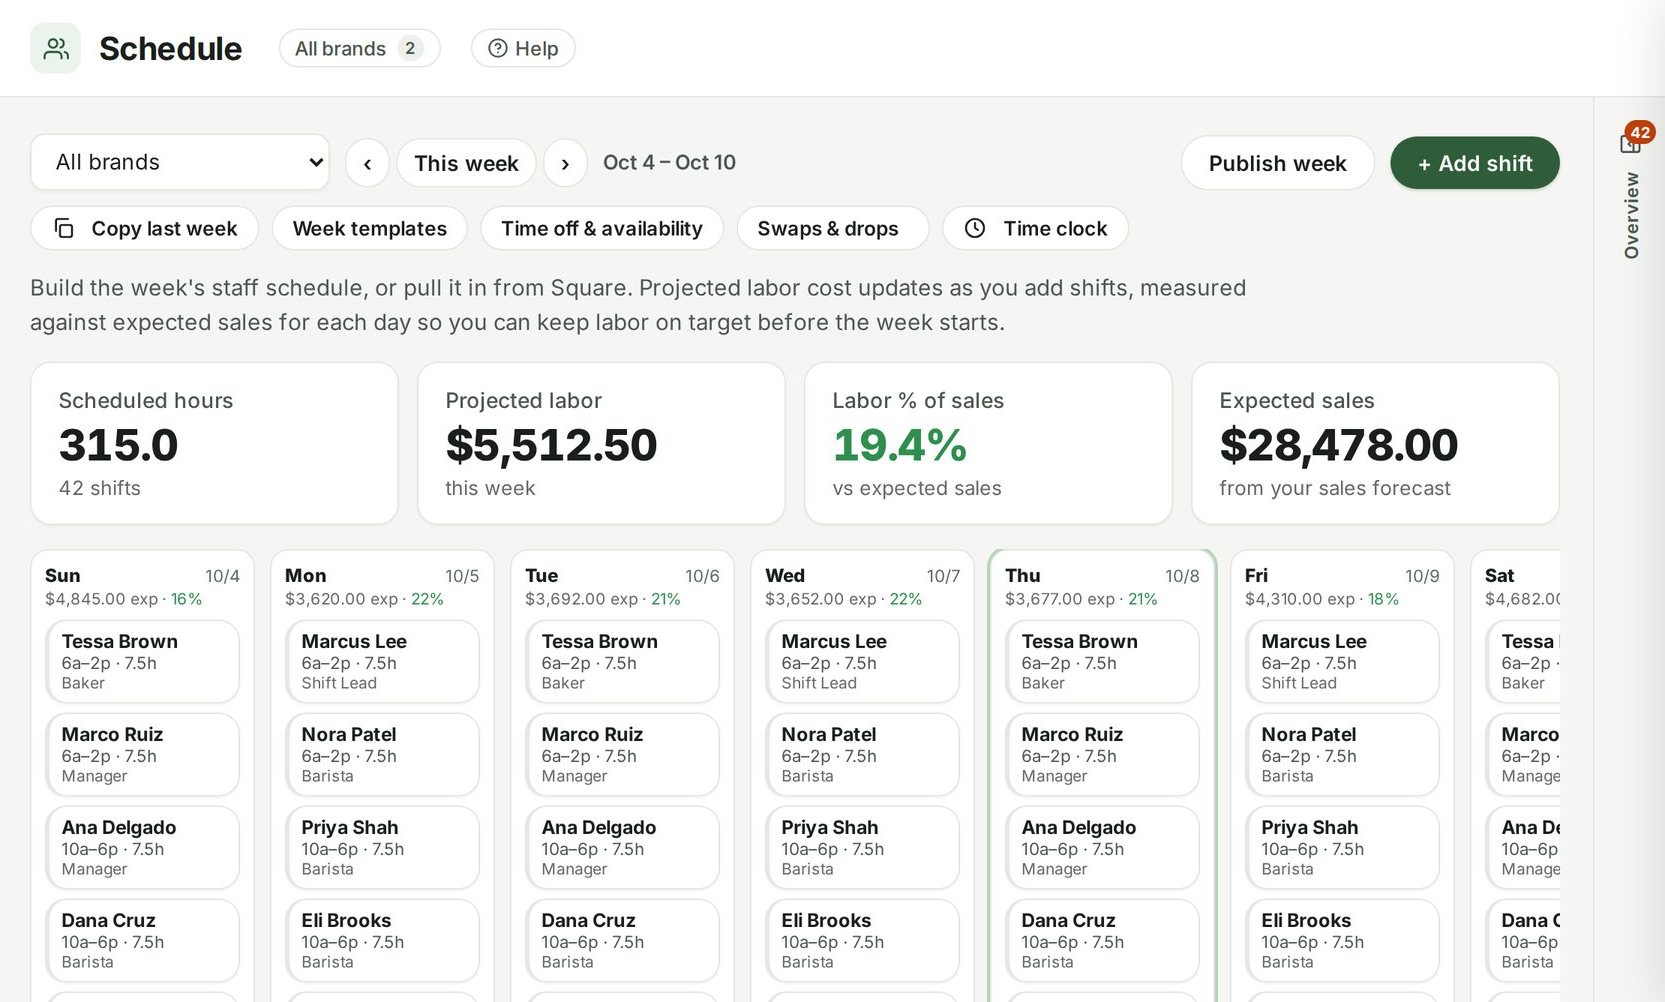
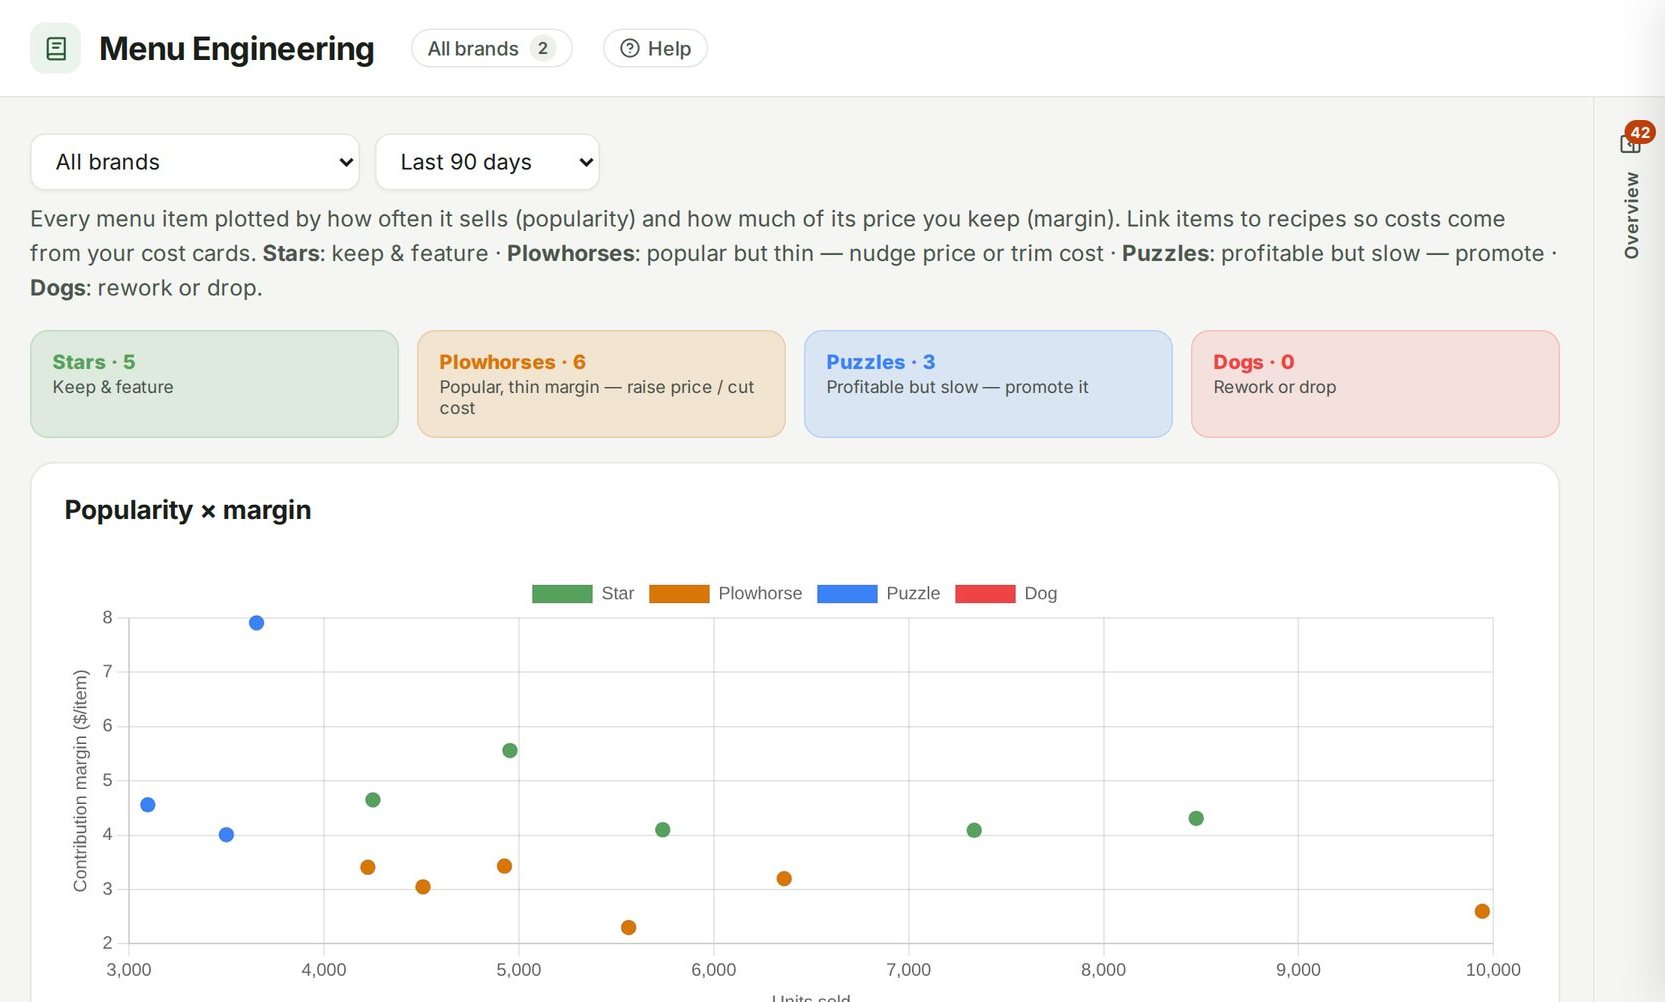
Nothing in Ospelia sits on its own. Sales reporting reads from and feeds these.


Good to know
Which POS systems does it read?
Square syncs automatically today. Other POS systems are planned — or enter a daily record by hand.
Multiple locations in different time zones?
Each location reports in its own local time, so ‘lunch’ means lunch everywhere.
Know where the day stands before you open.
Included in Operations, from $299 a location a month. Unlimited users. Set up in about fifteen minutes.
7 days free · cancel any time