A report on the whole restaurant, written up for you.
Pick the sections — sales, items, dayparts, labor, food cost, inventory, reviews, email, social, website, guests, events and competitors — and the period to compare. Ospelia builds a branded PDF with plain-English notes on what changed and a CSV of every number, and can email it every week or month.

Example data from the demo café in the live product.
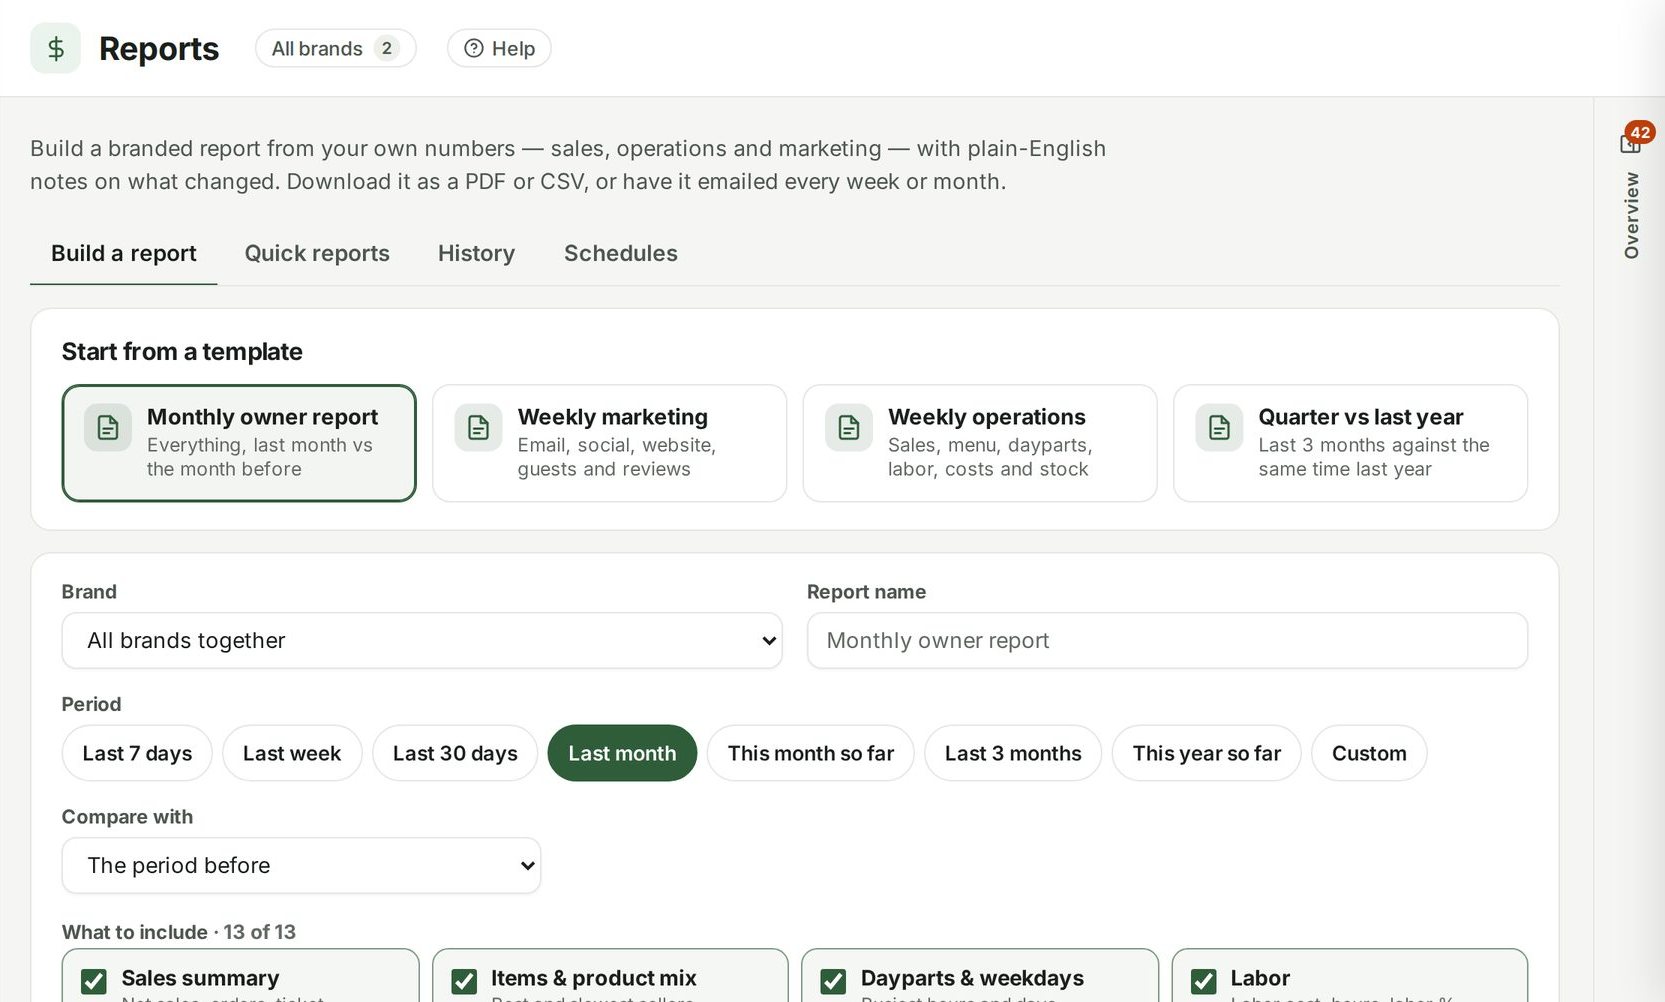
Reports, up close.
Choose the sections
Start from a template — monthly owner, weekly marketing, weekly operations, quarter vs last year — or tick your own from 13 sections.
Compare
Against the period before or the same time last year, for one brand or all of them together.
Notes you can trust
AI writes the short version, what stands out and what to do next — and any sentence with a number that isn't in your data is dropped.
Scheduled and saved
Email a report weekly or monthly, download it as a PDF or CSV, and reopen any past report from history.
Connected to
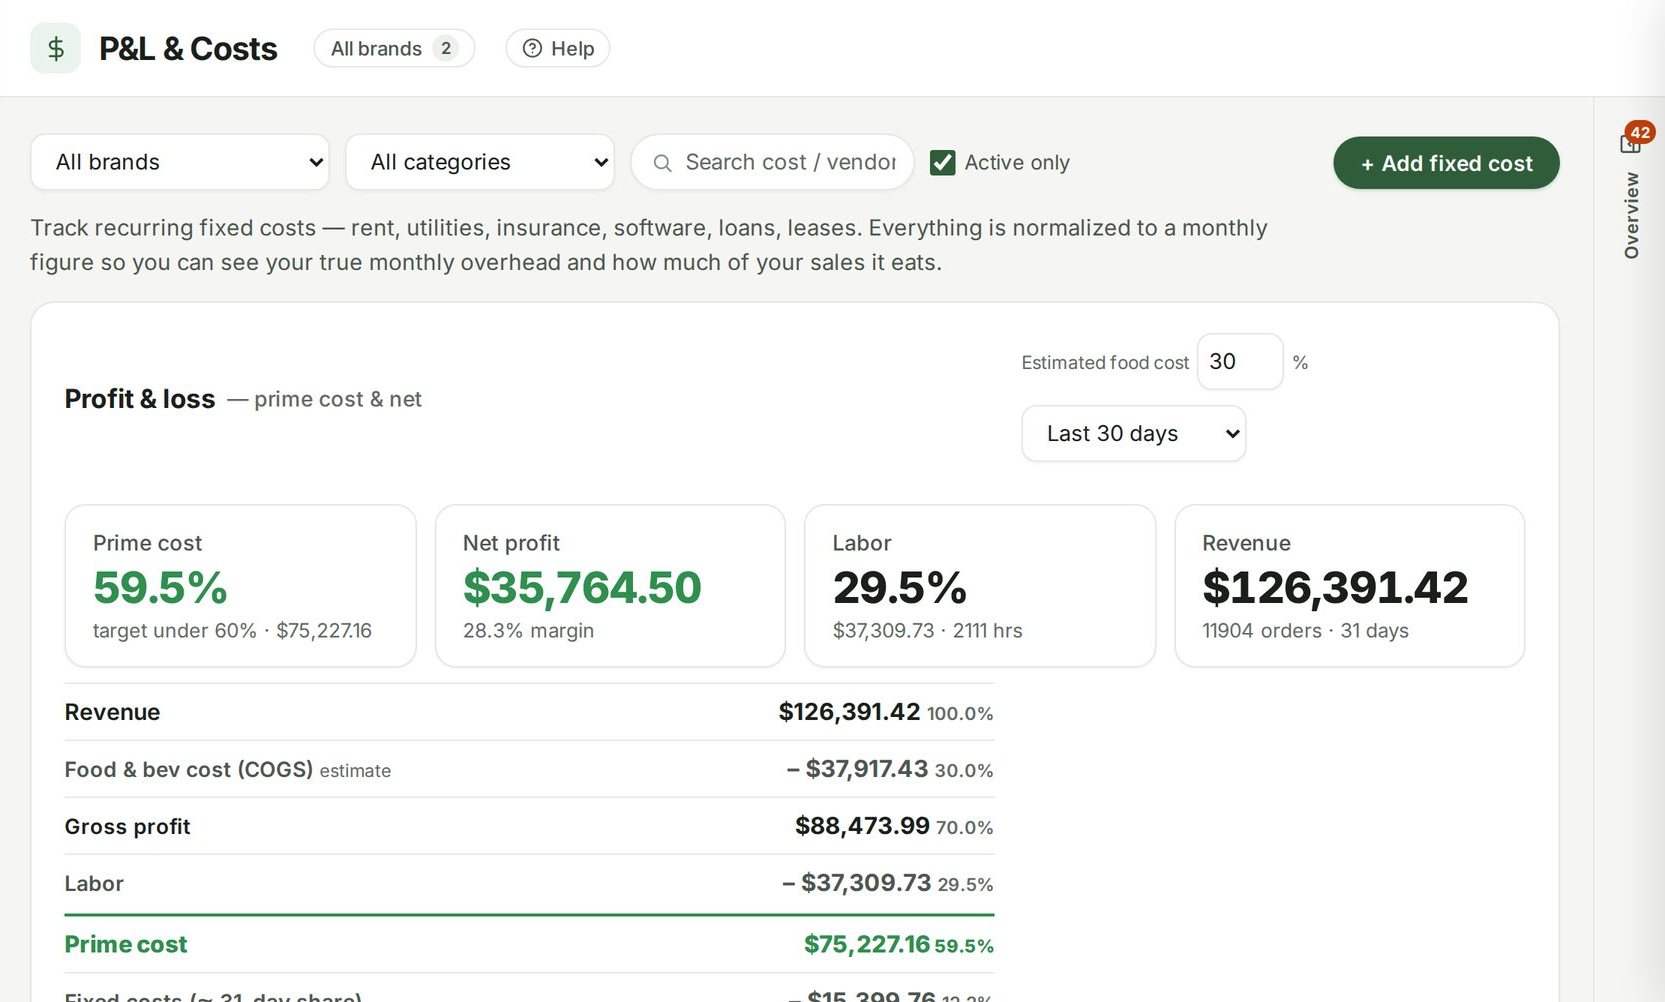
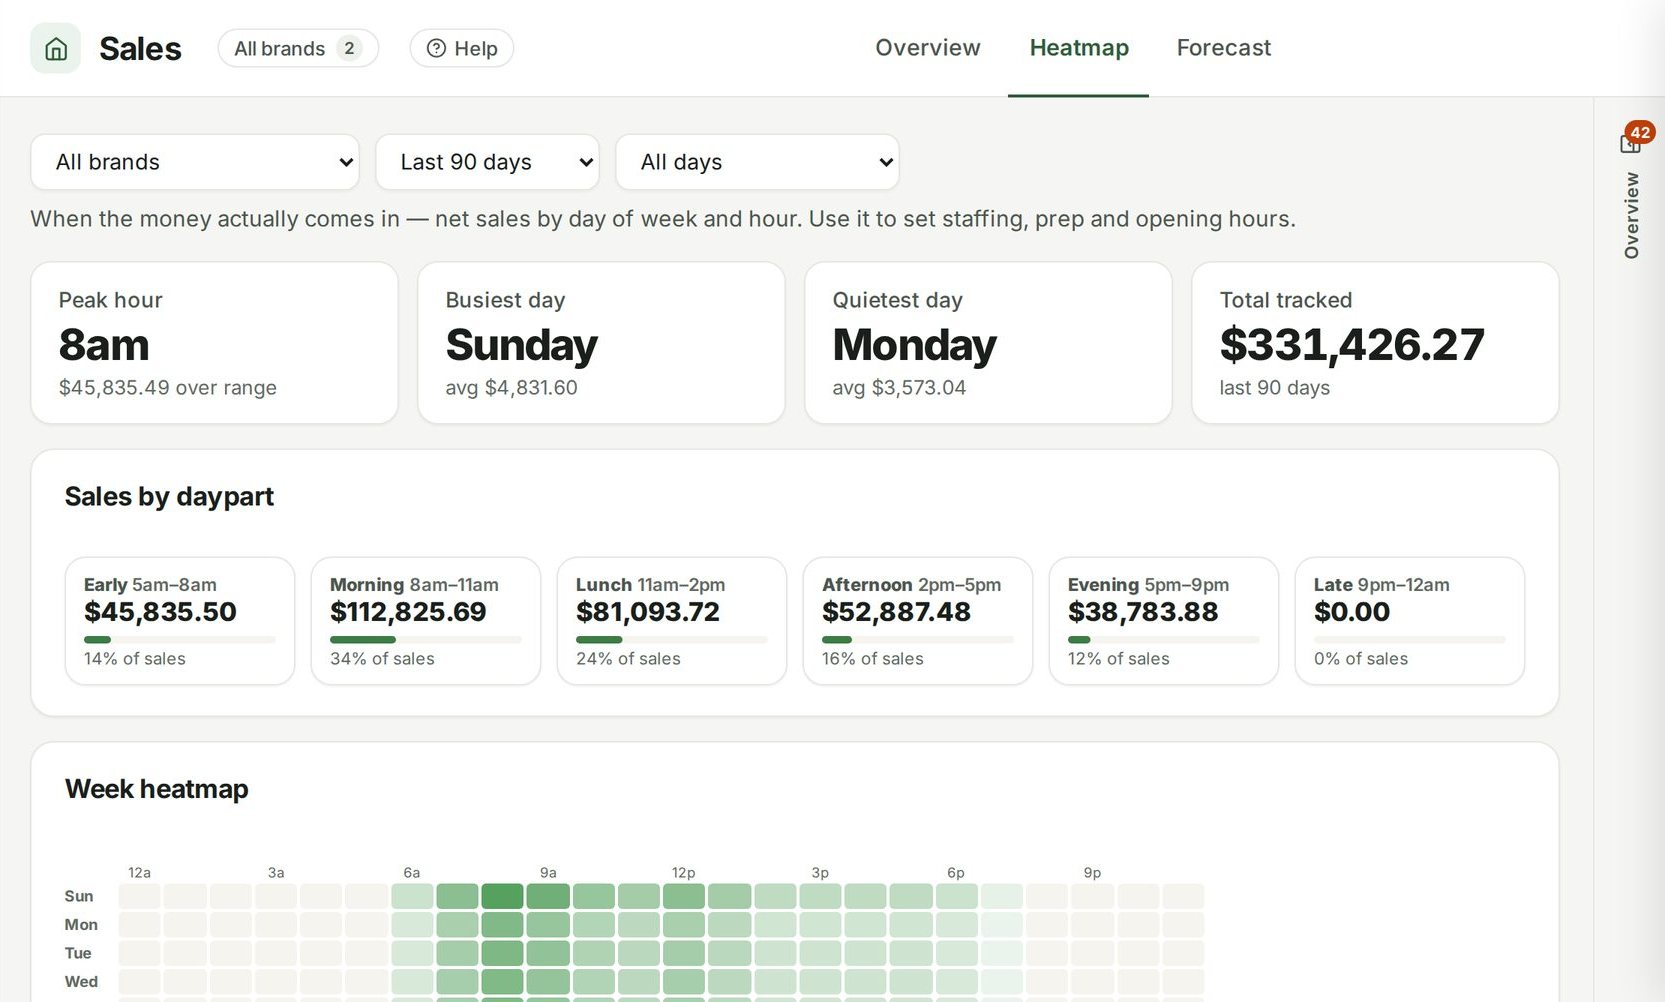
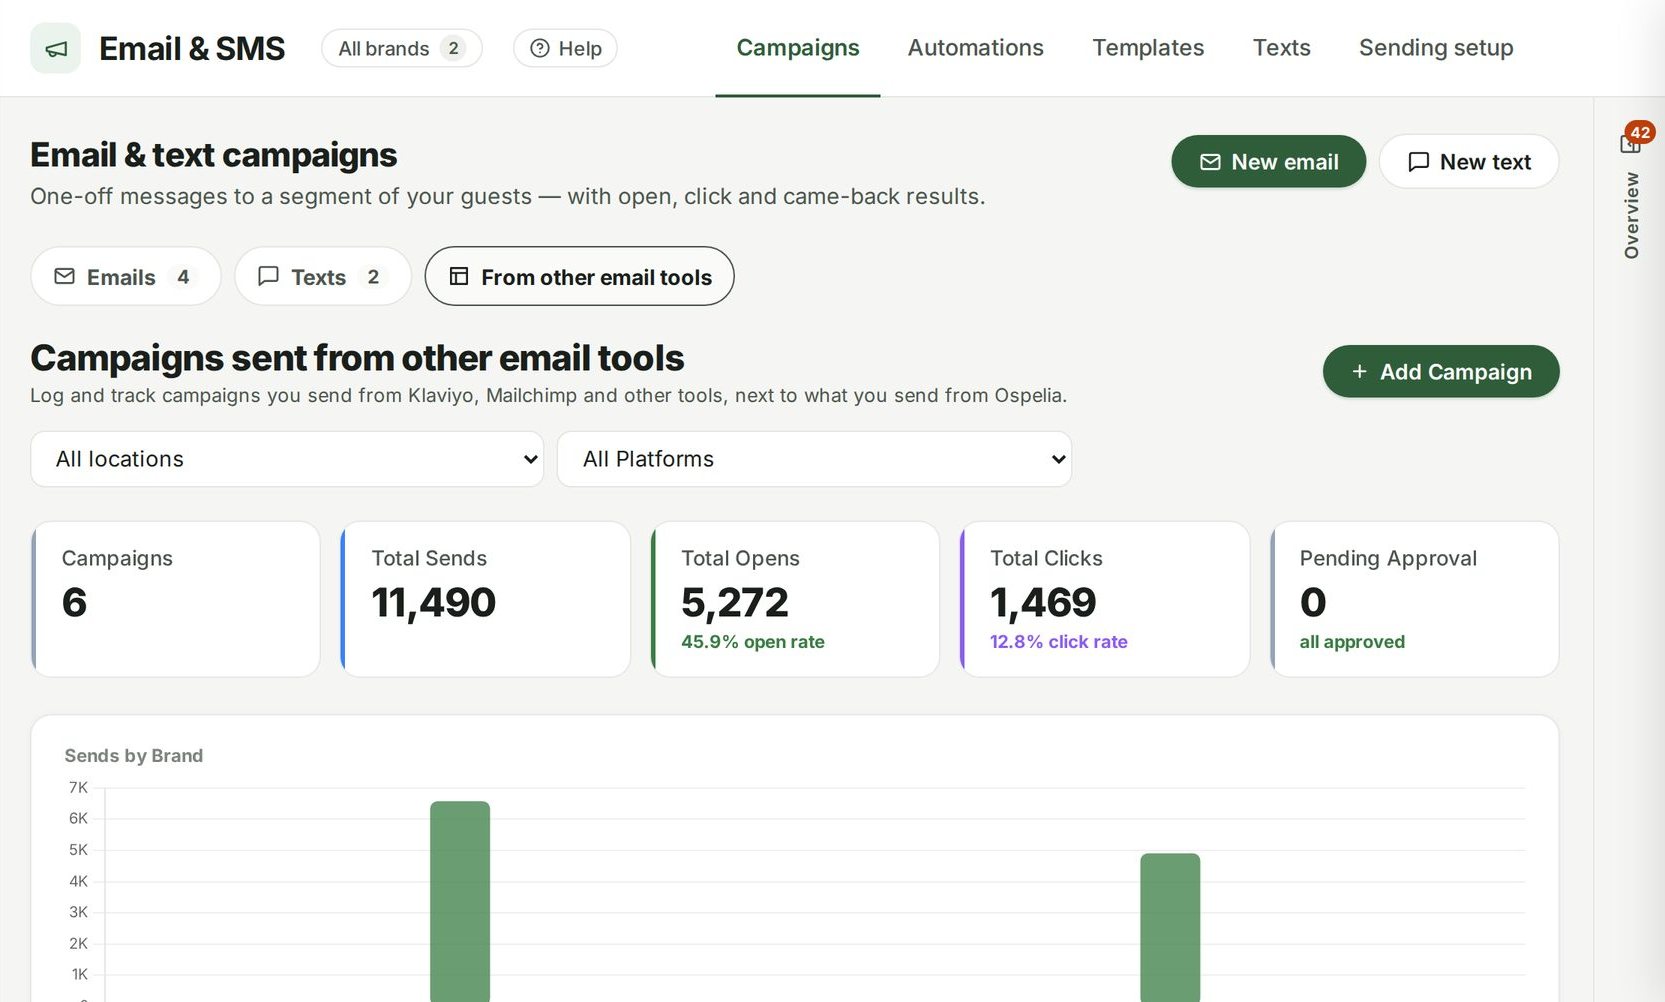
Nothing in Ospelia sits on its own. Reports reads from and feeds these.
Good to know
Who sees what in a report?
A report reads your data with your own login, so a manager only gets the brands and sections they're allowed to see.
Read your P&L on a Tuesday.
Included in Operations, from $299 a location a month. Unlimited users. Set up in about fifteen minutes.
7 days free · cancel any time